How good were the Stork Sports models in the World Cup?
The World Cup is over and it is time to evaluate how our statistical models performed.
For each game, our model estimated a chance of a win, draw, and loss for each team. Here are the general results:
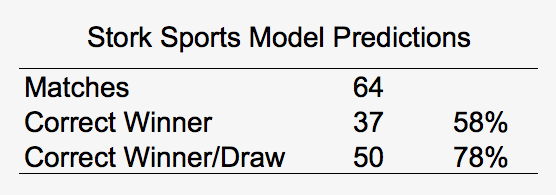
This means that in 58% of the games (37 games) the team with the highest chance of winning (by the Stork Sports Model) actually did win and in 78% of the games (50 games) this team did not lose the game. That is a good rate considering all predictions models and website you will find. But that is far from being the greatest value of our models.
We believe the biggest value our models have is in evaluating the risk in each game. It is easy to say that Belgium had a higher chance of winning then Panama when the teams played for group G but how much higher were the chances for Belgium is the key question to give you the most important information when analyzing a game, especially if you are trying to figure out if you should bet in this team.
So the biggest question is: when we say a team has a 55% chance of winning a game, does this team actually win 55% of the time?
Here are the results when we group all our predictions by the winning chance the model estimated:
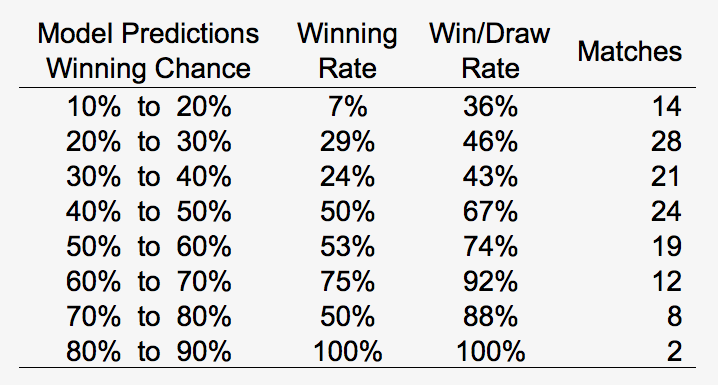
This table shows that our models are doing a good job in evaluating the risk. Although 64 games are not enough to full evaluating a strategy we have a clear indication that the Stork Sports Models are a strong and reliable tool for anyone analyzing football games.
If you have any other questions or suggestions send a message to stork@storksports.com and we will be glad to help you.
Stork Sports Team
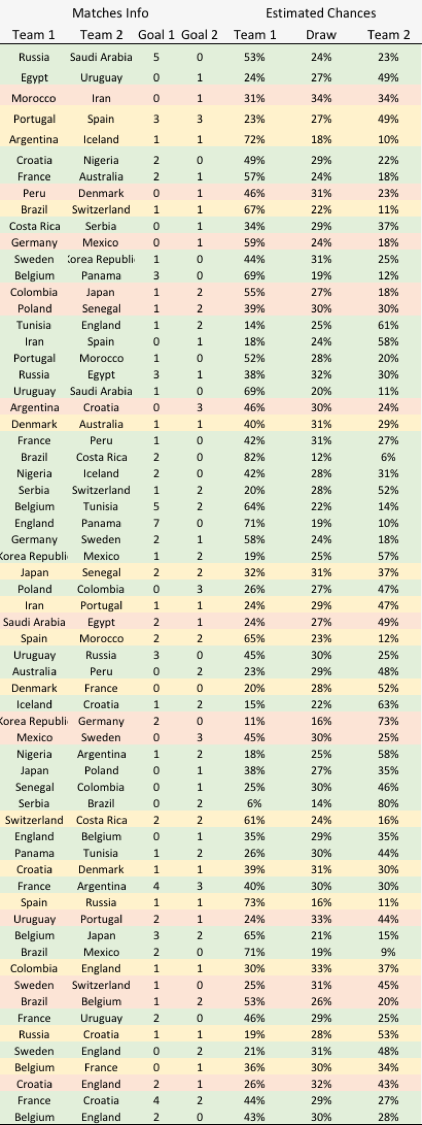
PS: Here are all 64 matches predictions for the World Cup