Betting on draws in football matches is one of the most popular strategies you will find. In this article, you will get the most important statistics on draws for the Brazilian Serie A, aka Campeonato Brasileiro or Brasileirao.
No time to read? Here are the key points of this article:
- The Brazilian Serie A has an overall average of 26% of matches results as a draw. This number has been somehow stable over the past seasons.
- The week into the season doesn’t seem to have a relation with the chances of a draw match. We have pretty much the same amount of draws on the beginning and the end of the season.
- Teams in the mid-table zone tend to have more chance of having draws.
- There is a clear relation between the points difference between the two teams playing and the chances of a draw. We observe most draws when the home steam has slightly fewer points than the away team.
- The number of draws a team had in the past does NOT help us predict if the team will draw in the future for Brazil’s league. The only exception is that teams with 0 draw in the past 5 matches tend to have more draws in the following match.
- Derbys INCREASE the chance of a draw.
- Match odds around 3.2 for the draw result had 30% of actual draws.
At Stork Sports, we have the best content, predictions, and tips on football draws. You can subscribe here for FREE to get all the information you need to win with the draw strategy.
FREE Draw Strategy List
You can also check our post on the draw statistics across the most important leagues here.
We also have our PRO draw list. This is our VIP group where we share all tips. You can subscribe here.
Before subscribing don’t forget to check our PAST RESULTS so you can know exact what to expect!
You can also check these articles to learn more about this strategy:
– Premier League
– Brazil – Serie A – Brazil – Serie B
– France Ligue 1 – France Ligue 2
– Russia Premier League
– Spain La Liga – Spain La Liga 2
In order to analyze the draw patterns on the Brazilian League, we analyzed the occurrence of draws through different dimensions.
We checked how frequent draw matches occurred depending on the season, team, week, points difference between teams, draw rate on past matches, team rivalries, and the odds of each match.
We will try to keep this page as simples as possible as the numbers mostly speak for themselves!
Brazil’s Serie A Draws Over Time
The first questions we need to answer are:
– What is the percentage of matches that result in a draw on the premier league?
– Does this percentage change over time?
Since the 2003 season, 26.04% of the Brazilian league matches ended up tied.
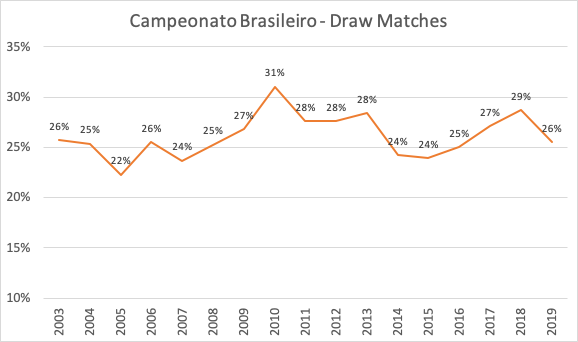
The percentage (%) of draw matches varies over the seasons, the lowest percentage was recorded in the 2005 season (22%) and the highest on the 2010 season (31%).
Brazil’s Serie A Draws – weeks during the season
Does the occurrence of draw matches vary depending on the week the game is played? In other words, do matches at the beginning of the season have more draws then the matches at the end of the season?

There is almost no difference in the percentage of matches that end up tied depending on the week of the season. In the first 10 weeks (1-10) of the season, we have 27% of draw matches while at the end of the season (31-38) we have 26% of draw matches. A very small effect.
Brazil’s Serie A Draws – what teams draw matches the most?
We analyzed data from the 2003 season until the 2019 season. Here are the teams with the highest percentage of draw matches:
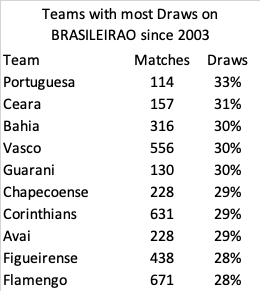
They are mostly mid to end of the table teams. To understand the relation between the team’s strength and the number of draws we can check the teams with most draws by season and their position on the table at the end of the season:
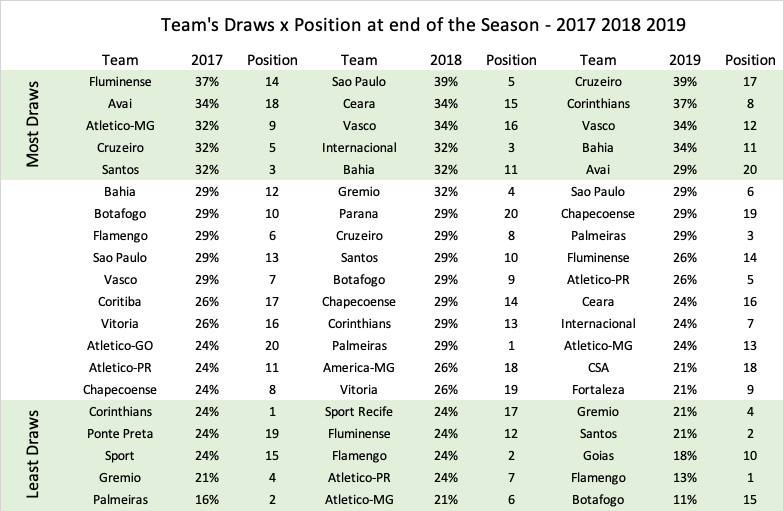
We can see that usually, the top teams have fewer draws while mid of the table teams tend to have more draws.
Brazil’s Serie A Draws – points difference between home and away teams
When predicting a draw match the most straightforward statistics we could look in is the points difference between the two teams that are playing.
In order to measure if this is a good way to analyze a match we investigated how many draws happened depending on the points difference considering the last 20 matches of each team:
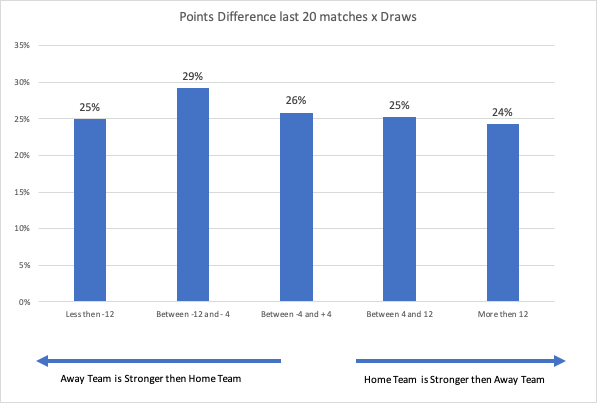
As expected teams that have a huge points difference have fewer draws. We observe the most draws when the points difference between the home and away team is between -12 and -4. This means that we have more draws when the away team is slightly better than the home team.
Brazil’s Serie A Draws – do past draws help predict future draws?
Is there a pattern for draws in some teams? Do some teams have a higher chance of drawing because they had more draw games in the past?
To answer this we must compare the number of draws in the past games of a given team with the chance of drawing the next match. We did this for the past 5 and the past 20 matches of each team:
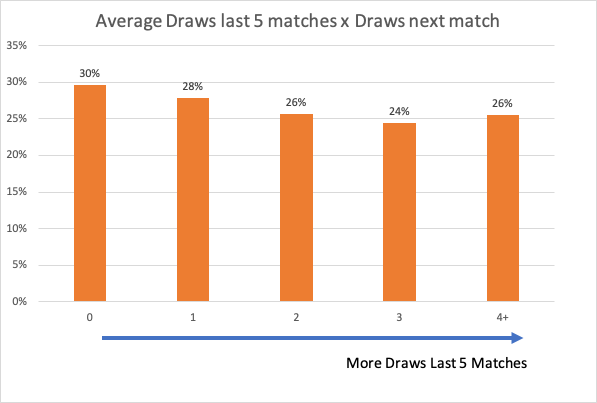

There is NO clear relation between past draws and the chances of the team having a draw match in the future.
The only small relation is the opposite we expected – teams with FEWER past draws tend to have more draws in the future. This effect is known as REGRESSION TOWARD THE MEAN.
Brazil’s Serie A Draws – Derbys and Rivalries
Derbys and rivalry matches are just different. We considered the following matches as Derbys: Atletico-MG x Cruzeiro, Atletico-PR x Coritiba, Flamengo x Fluminense, Flamengo x Vasco, Flamengo x Botafogo, Fluminense x Vasco, Fluminense x Botafogo, Vasco x Botafogo, Gremio x Internacional, Palmeiras x Corinthians, Palmeiras x Santos, Palmeiras x Sao Paulo, Corinthians x Santos, Corinthians x Sao Paulo, Santos x Sao Paulo.
The Derby matches had an average of 31.85% of draw matches against 25.45% of draws on regular matches.
Brazil’s Serie A Draws – What do the odds tell us?
The odds of a given result in a match can tell us a lot about what it is going to happen. Here are the outcome of matches relating to the odds of the draw before the match:
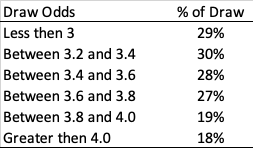
Betting on draws when the odds are around 3.2 have a 30% chance of winning.
Brazil’s Serie A Draws – What can we conclude?
- The Brazilian Serie A has an overall average of 26% of matches results as a draw. This number has been somehow stable over the past seasons.
- The week into the season doesn’t seem to have a relation with the chances of a draw match. We have pretty much the same amount of draws on the beginning and the end of the season.
- Teams in the mid-table zone tend to have more chance of having draws.
- There is a clear relation between the points difference between the two teams playing and the chances of a draw. We observe most draws when the home steam has slightly fewer points than the away team.
- The number of draws a team had in the past does NOT help us predict if the team will draw in the future for Brazil’s league. The only exception is that teams with 0 draw in the past 5 matches tend to have more draws in the following match.
- Derbys INCREASE the chance of a draw.
- Match odds around 3.2 for the draw result had 30% of actual draws.
At Stork Sports, we have the best content, predictions, and tips on football draws. You can subscribe here for FREE to get all the information you need to win with the draw strategy.
FREE Draw Strategy List
Great statistical overview and suggestions for placing bets on matches… Hope you continue to do so…