
Is it possible to predict the number of goals in a given match?
This is the first of three posts that try to answer this question!
Who are you and why would that be important?
If you are new at Stork Sports, you can find here what we do and how we recommend games. And you can signup to your newsletter here and get our content and bet tips at first hand!
It could be interesting to predict the number of goals just to help us understand the patterns that we can find and what factors are important when analysing a match but it is also very important when we want to get in the Under/Over goals market. For those who are not familiar, it is a very popular bet market in which you bet on the number of goals (or if the match will have over/under a number of goals).
Part I – The general pattern
In this first post, we will look at patterns in the number of goals in a very general way. We will analyse how this number changes in different leagues and through time. To do so we will use data from 5 leagues: Bundesliga, Campeonato Brasileiro, La Liga, Serie A and Premier League, from 2003/2004 to the 2016/2017 season.
The first information we will look is the exact score in a match, the next figure shows the % of matches with each score:
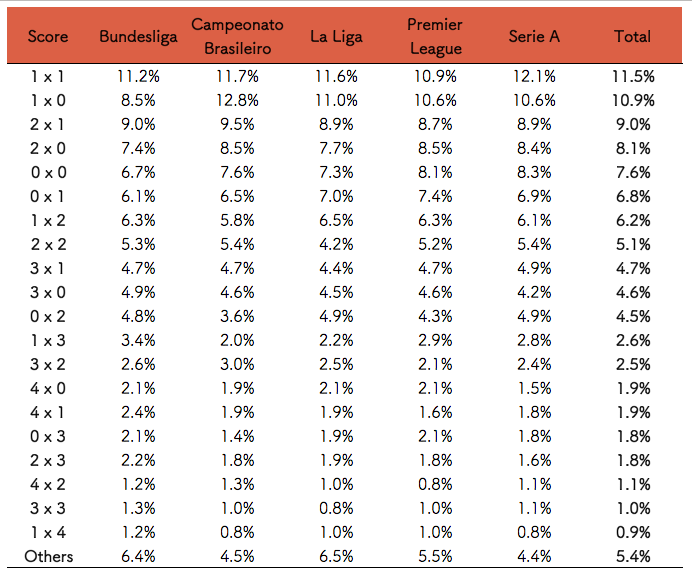
The first pattern we notice is that in all league the scores 1×1, 1×0, 2×1, 2×0, 0x0, 0x1 and 1×2 are the most common and together they happen in more than 50% of the matches. Now let’s look at the total number of goals in each match:
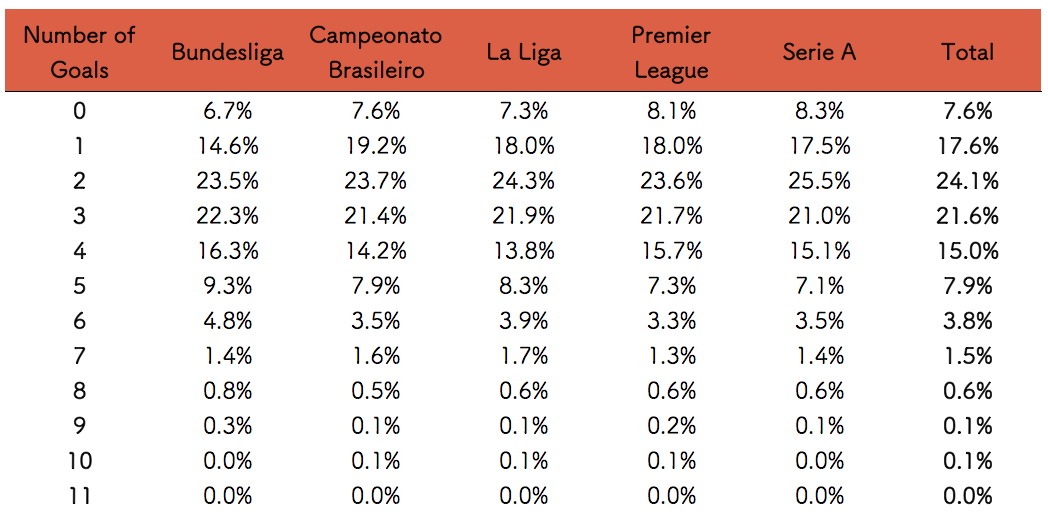
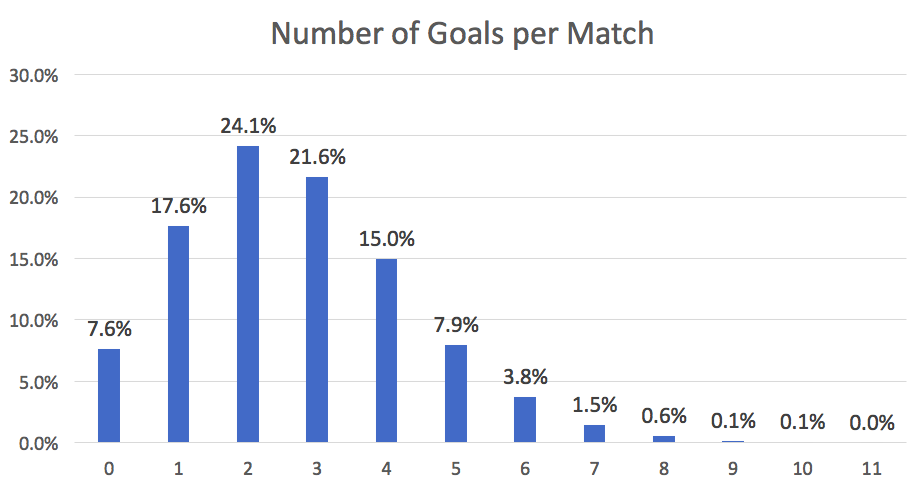
In all leagues, most matches have 1-3 goals. About the same number of matches have 0 goals and 5 goals. More than 5 goals matches are rare. But let’s look at this information in the Over/Under view:
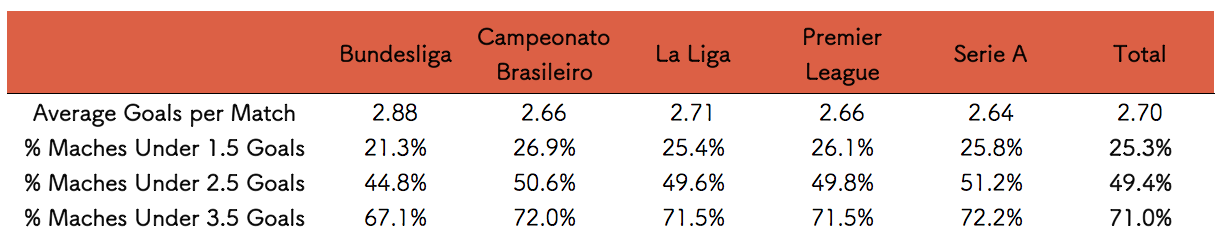
We can see that the league with most goals per match is the Bundesliga and Serie A has the least. But it is important to remember that we are looking at data from over 10 years of matches.
We should look what happened over time:
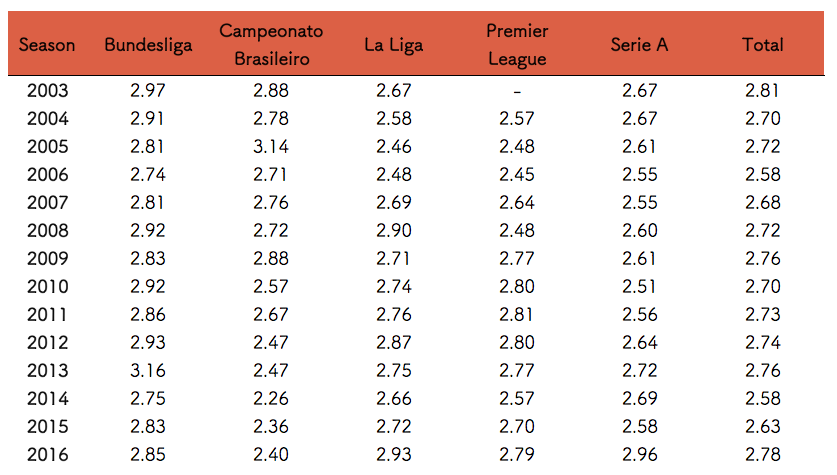
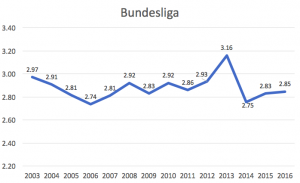
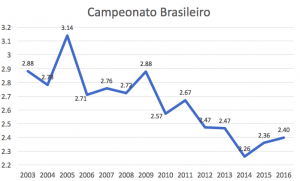
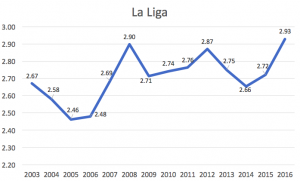
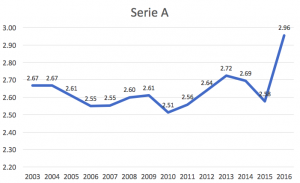
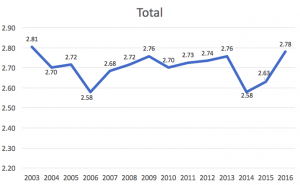
We don’t see a general trend in the number of goals, but we do notice some patterns in each league. The strongest pattern is the decline of the number of goals in the Brazilian leagues in the last 10 years. In the other leagues we see a variance in the results but no clear trend, for example, last years Serie A had the most number of goals in many years but we can’t consider that a trend yet.
The next figure shows the impact of these numbers in the % of matches with under 2.5 goals:
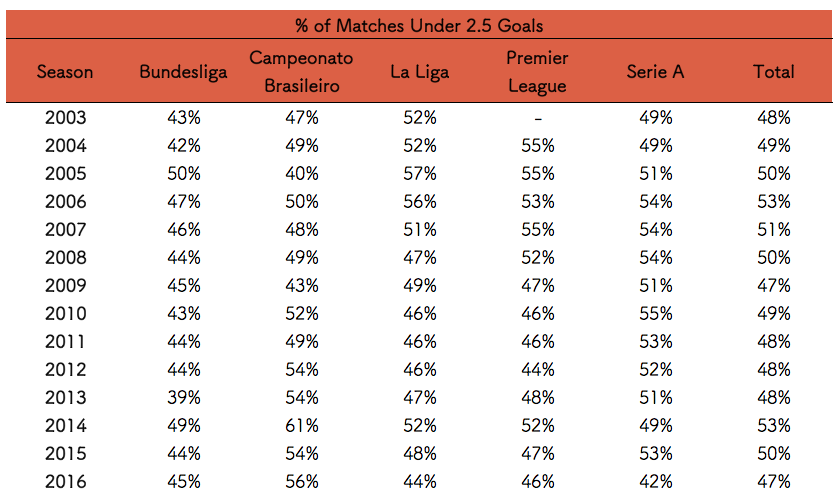
The biggest difference in time is still in the Brazilain league, but we also can see some difference in the last couple years in La Liga and since 2009 in the Premier League. The number of matches with under 2.5 goals declined in those leagues.
Another dimension we can look at the number of goals is during a season how it changes over the weeks:
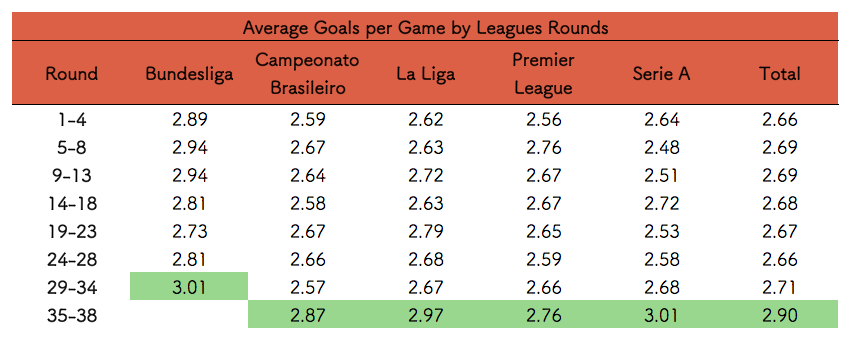
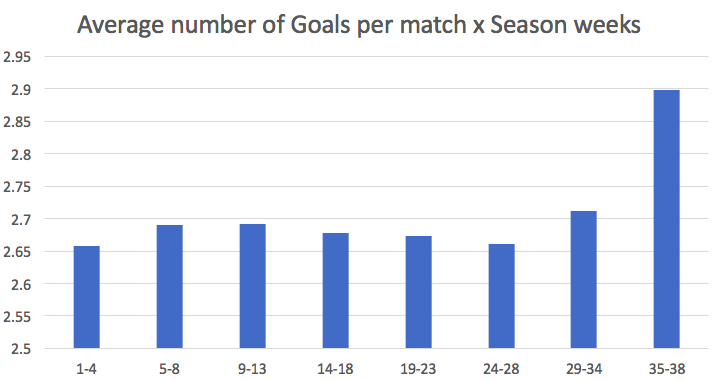
Now we can clearly see a pattern, the matches in the last weeks of each league have more goals. This happened in all the leagues we analyzed. We can expect more matches with over 2.5 goals by the end of the season.
Very nice, but how can I predict the number of goals in a match?
All this information can help us understand what to expect in the over/under market in a general way and it is the first step to predict a single game. If you made it up to here you are on the right track, congrats!
The question we need to answer now is, what information should we look at to predict a game? Is it the last 5 games number of goals? How good is the attack? How many goals have the teams scored? If you want to know what is the best info to look to predict games, don’t miss our next post! We will tell you what is the most powerful information and what information is misleading. It is coming in the next days, so don’t forget to subscribe to our newsletter and be the first to get our reports and also our free predictions and tips!
PART 2 is already available! Don’t miss it!
See you soon!
Stork Sports Team
One thought on “Over 2.5 – How to predict the number of goals (PART I)”